The Reports module provides data-driven insights into the financial health and operational efficiency of your clinic. It offers real-time visualization of revenue streams and appointment volume, helping administrators make informed decisions.
!Note: This module is strictly accessible to Administrators and Clinic Admins only.
1. Accessing Reports
To view the analytics dashboard:
Navigate to Reports in the main menu.
2. Dashboard Interface & Filters
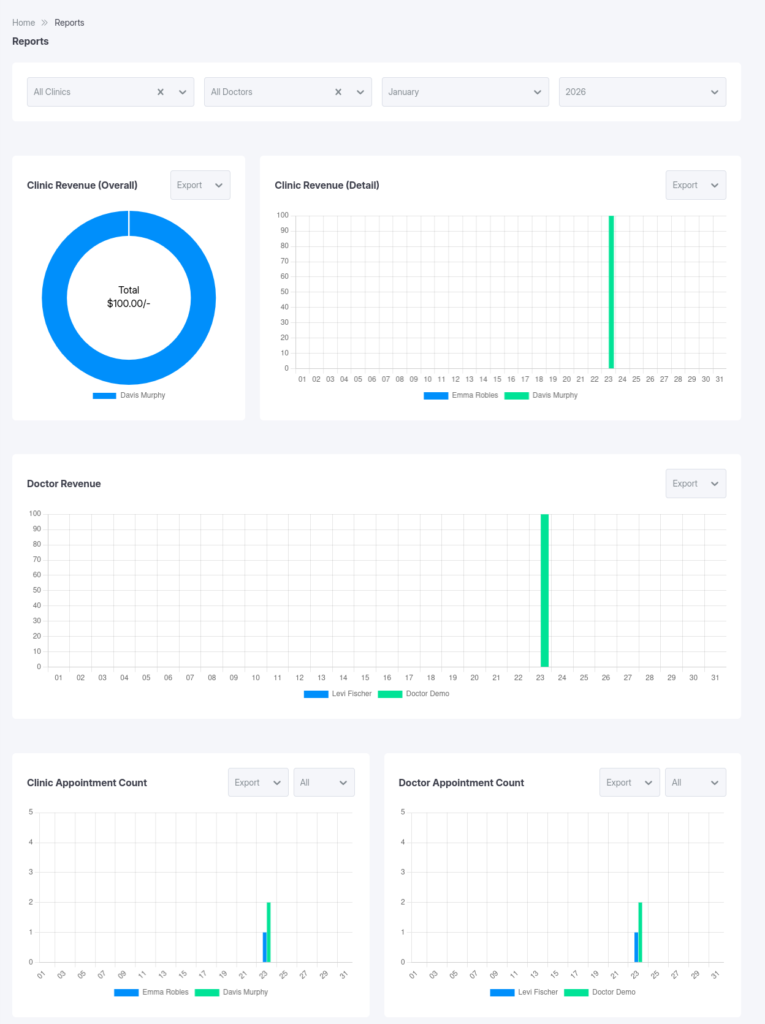
The Reports dashboard features a global filter bar at the top, allowing you to refine the data displayed across all charts. Description: A full-screen capture of the Reports page. Highlight the top filter bar (Clinic/Doctor/Month/Year dropdowns) and the layout of the charts below.
Global Filters
Select Clinic: (Administrator Only) Choose a specific facility to view its individual performance.
Select Doctor: Filter data for a specific practitioner.
Month & Year: Adjust the timeframe to analyze historical data or current performance.
3. Key Sections
The dashboard is divided into five primary analytic components:
A) Clinic Revenue (Overall)
Type: Doughnut Chart
Purpose: Displays a high-level percentage breakdown of revenue generated by different clinics (if multiple exist) or revenue categories.
Insight: Quickly identify which clinics are your top earners.
B) Clinic Revenue (Detail)
Type: Bar Chart
Purpose: Provides a granular view of revenue figures.
Insight: Compare actual earnings value across different clinics side-by-side.
C) Doctor Revenue
Type: Bar Chart
Purpose: Break down the total revenue generated by each doctor within the selected clinic and timeframe.
Insight: Evaluate individual performance and financial contribution.
D) Clinic Appointment Count
Type: Bar Chart
Purpose: Tracks the volume of appointments handled by the clinic.
feature: Includes an internal filter to view appointments by status (e.g., Booked, Completed, Cancelled).
Insight: specialized in understanding patient footfall and operational load.
E) Doctor Appointment Count
Type: Bar Chart
Purpose: Shows the number of appointments assigned to each doctor.
Feature: Also allows filtering by appointment status.
Insight: Helper in balancing workload among staff.
Description: A focused screenshot showing the “Clinic Appointment Count” and “Doctor Appointment Count” charts, highlighting the status dropdown filter within the chart card.
4. Permissions
Access to this analytic data is restricted to ensure confidentiality.
Administrator: Has Full Access to view reports for all clinics and all doctors.
Clinic Admin: Restrictions to viewing reports only for their own clinic and the doctors assigned to it.
Doctors / Receptionists / Patients: These roles do not have access to the Reports module.