Comprehensive business intelligence and analytics for clinic performance, revenue tracking, and data-driven decision making.
Overview KiviCare Pro includes powerful reporting and analytics features to help you understand your clinic’s performance, track revenue, monitor appointments, and make data-driven decisions.
Key Benefits
Visual Analytics: Beautiful charts and graphsRevenue Tracking: Clinic and doctor-wise revenueAppointment Analytics: Booking patterns and trendsMulti-Clinic Comparison: Compare performance across locationsDoctor Performance: Track individual doctor metricsExport Capability: Download reports for presentationsReal-Time Data: Always up-to-date information
Available Reports 1️⃣ Clinic Revenue (Overall) Chart Type: Doughnut / Pie ChartPurpose: See revenue distribution across all clinics at a glance
Displays
Total revenue per clinic
Percentage of total revenue
Visual comparison between clinics
Color-coded by clinic
Example
Total Revenue: $125,000

Downtown Clinic: $60,000 (48%)
Uptown Clinic:   $45,000 (36%)
Westside Clinic: $20,000 (16%)
Use Cases
Identify top-performing clinics
Spot underperforming locations
Justify expansion decisions
Allocate resources effectively
2️⃣ Clinic Revenue (Detail) Chart Type: Bar ChartPurpose: Detailed month-by-month or clinic comparison
Displays
Revenue bars for each clinic
Side-by-side comparison
Trend analysis
Actual dollar amounts
Filter Options
Specific month or all months
Specific year
Single clinic or all clinics
Example
January 2026:
Downtown: $15,000 ████████████████
Uptown:   $12,000 ████████████
Westside: $ 6,000 ██████
Insights
Month-over-month growth
Seasonal patterns
Clinic comparison
Performance trends
3️⃣ Doctor Revenue Chart Type: Bar ChartPurpose: Track revenue generated by each doctor
Displays
Revenue per doctor
Comparison across doctors
Filter by clinic
Time-based analysis
Filter Options
All doctors or specific doctor
Specific clinic
Month and year selection
Example
Dr. Smith: $25,000 ████████████████████
Dr. Jones: $18,000 ██████████████
Dr. Lee:   $15,000 ████████████
Metrics Include
Total revenue generated
Number of appointments
Average revenue per appointment
Billing efficiency
4️⃣ Clinic Appointment Count Chart Type: Bar ChartPurpose: Monitor appointment volume per clinic
Displays
Total appointments by clinic
Status breakdown
Comparison across clinics
Trend over time
Status Filters
All
Booked
Pending
Completed
Check-in
Cancelled
Example
Downtown Clinic:
├─ Booked: 150
├─ Completed: 280
├─ Cancelled: 20
└─ Total: 450
Key Metrics
Appointment volume
Cancellation rate
Completion rate
Booking trends
5️⃣ Doctor Appointment Count Chart Type: Bar ChartPurpose: Track appointment volume per doctor
Displays
Appointments per doctor
Status breakdown
Workload comparison
Capacity utilization
Example
Dr. Smith: 230 ██████████████████
Dr. Jones: 180 ██████████████
Dr. Lee:   150 ████████████
Insights
Doctor utilization
Workload balance
Scheduling efficiency
Capacity planning
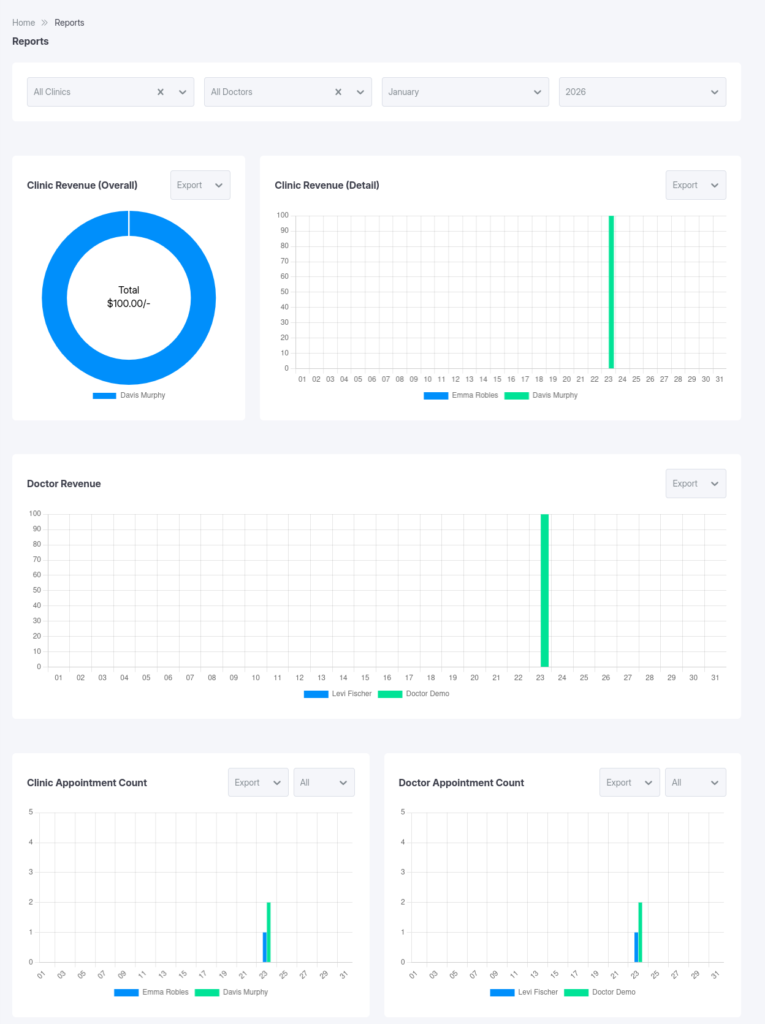
Reports Dashboard Accessing Reports
Menu: Dashboard → Reports
Access Levels
Administrator: All reports
Clinic Admin: Own clinic
Doctor: Own statistics
Receptionist: Limited (if enabled)
Filter Controls
Clinic Filter
[All Clinics ▼]
Doctor Filter
[All Doctors ▼]
Month Filter
[Current Month ▼]
Year Filter
[2026 ▼]
Applying Filters
Select clinic
Select doctor (optional)
Choose month/year
Charts update automatically
Reading Charts Doughnut Chart
Each slice = clinic
Size = revenue share
Hover for details
Bar Charts
Height = value
X-axis = clinic/doctor
Y-axis = revenue/count
Hover for breakdown
Analysis & Insights Revenue Analysis
Top-performing clinics
Growth/decline trends
Seasonal patterns
Doctor profitability
Appointment Analytics
Cancellation Rate
Cancelled ÷ Total × 100
Completion Rate
Completed ÷ Total × 100
Doctor Performance
Workload balance
Revenue per appointment
Patient retention
Exporting Reports Export Formats
PDF
CSV / Excel
PNG / JPG
Export Methods
Browser print
Screenshot
Export button (if available)
Custom Date Ranges
Month-over-month
Year-over-year
Quarterly comparison
Best Practices Review Frequency
Weekly: Appointments
Monthly: Revenue
Quarterly: Strategy
Annually: Growth
KPIs to Track
MRR
ARPU
Booking Rate
No-show Rate
Patient LTV
Troubleshooting No Data Showing
Relax filters
Check permissions
Verify date range
Charts Not Updating
Hard refresh
Clear cache
Check console
Export Issues
Disable pop-up blocker
Try a different browser
Use screenshots
Mobile & Responsive
Fully responsive charts
Touch & gesture enabled
Best viewed on tablet/desktop
Related Features
Multi-Clinic Management
Billing & Tax System
Medical Reports
Advanced Analytics (Future)
Predictive analytics
Revenue forecasting
Custom report builder
Scheduled reports
Dashboard widgets